Neighborhood Drug Dens

As the opioid epidemic continues across the county, authorities are confronting the return of another scourge they thought they’d conquered years ago.
Methamphetamine prompted national concern in the early aughts, an era in which small-scale manufacturers would “cook” the drug in makeshift labs. In 2006, Congress regulated the sale of precursor ingredients, a move that stemmed the tide of meth through American communities. In recent years, however, the drug’s availability and potency have once again surged nationwide—a shift DEA officials attribute to Mexican cartel production on an unprecedented scale.
In this project, we studied over a decade of data relating to the DEA’s efforts to disrupt the production and distribution of meth. We analyzed thousands of meth lab busts and seizures nationwide and tracked the chronological and geographical trends of this resurgent threat.
Our data can help you learn where meth has been made in your community and where it continues to pose problems.
Meth Cooked Close to Home
Drug production often entails some agricultural element; cocoa, marijuana, or poppy cultivation can utilize vast tracts of land. But because meth can be made using inexpensive chemicals found in over-the-counter medications, it lends itself to clandestine manufacture inside inconspicuous buildings.
These meth labs have been discovered in every state, sometimes because an error in the “cooking” process produces a deadly explosion. But in many cases, neighbors are unaware that they live near the current or former site of a meth manufacturing operation.
Mapping Meth Labs

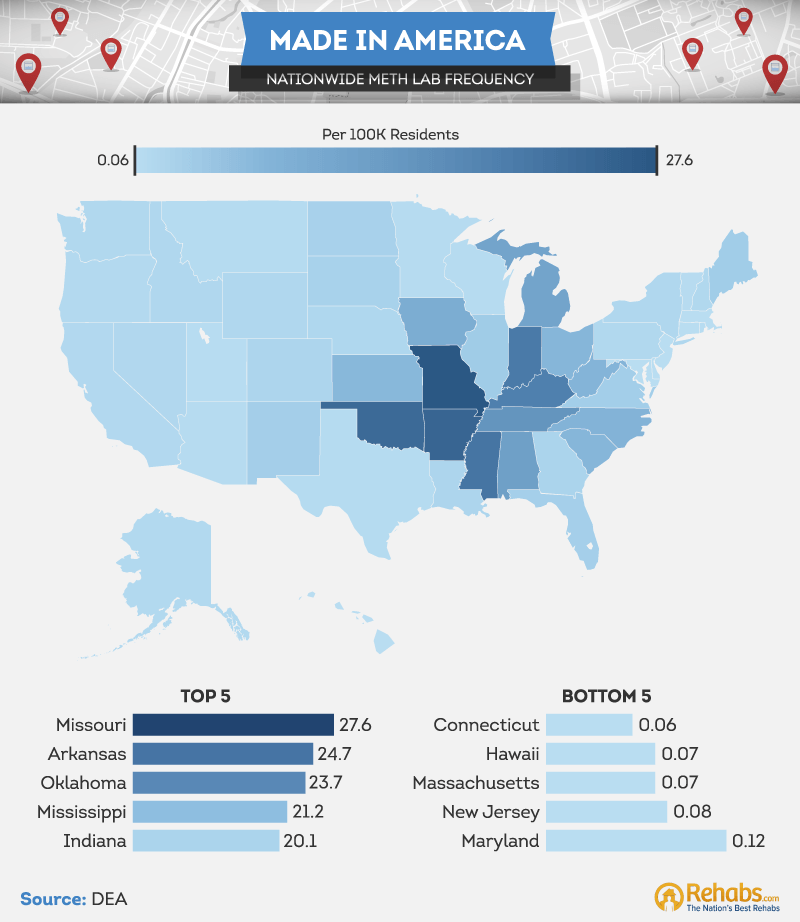
Although no state is entirely unaffected by meth’s presence, certain places emerged as manufacturing hubs in our analysis.
- Missouri had 27.6 meth labs per 100,000 residents: Authorities regarded the state as America’s meth production capital until Mexican cartels came to dominate the trade in recent years. Bible Belt states also witnessed numerous labs per capita, including Arkansas, Mississippi, and Oklahoma.
- Northeastern states tended to have fewer meth labs per capita: Maryland, Massachusetts, and New Jersey ranked among the bottom five states.
- Connecticut had the fewest overall: This is an interesting finding given the high rates in states further down the Eastern Seaboard, such as the Carolinas.
- Hawaii had relatively few labs per capita: This stat contrasts sharply with the state’s past and current struggles with the substance. Local law enforcement has considered “ice” a dangerous threat to the islands since it arrived from Asia over three decades ago – and use shows few signs of slowing.
Quantity and Potency Across the Country

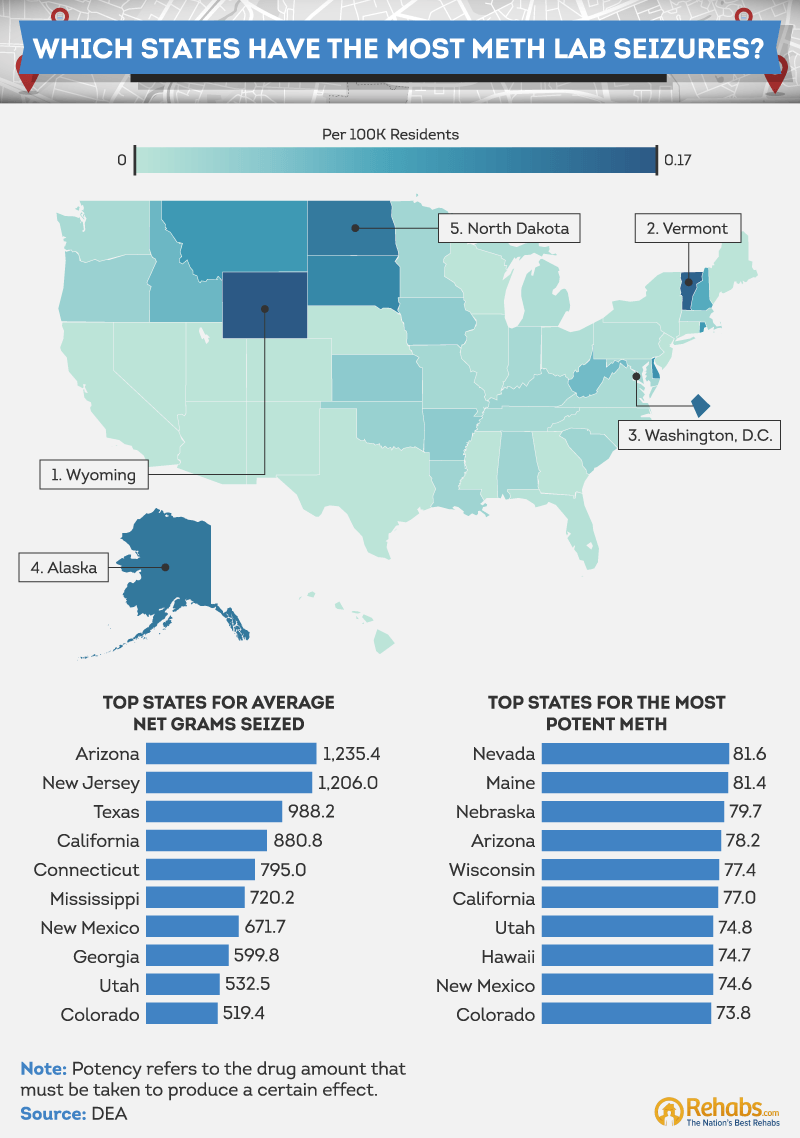
In DEA busts in which methamphetamine was seized, the quantity and purity of the confiscated product varied considerably.
The states where seizures were most frequent, such as Vermont and Wyoming, did not have the biggest busts on average. States with the largest average amounts seized had relatively few seizures per capita.
These patterns may reveal differences in law enforcement strategy by state: In places with concentrated manufacturing networks, big stings can be effective. In places where meth-making is more diffused, a greater number of smaller busts may be warranted.
Average potency figures from each state also presented compelling contrasts. Nevada had the highest degree of purity overall; perhaps it’s no surprise that the state leads the nation in deaths resulting from the use of stimulants.
Meth seized in Maine was nearly as potent, and the crisis in the state has caused lawmakers to consider requiring a prescription to purchase cold medicine containing precursor ingredients. But the most concerning mix of statistics may have emerged from Arizona. Ranked first for average seizure size and fourth for potency, the state possesses a deadly mix of quantity and potency.
Price and Purity Over Time

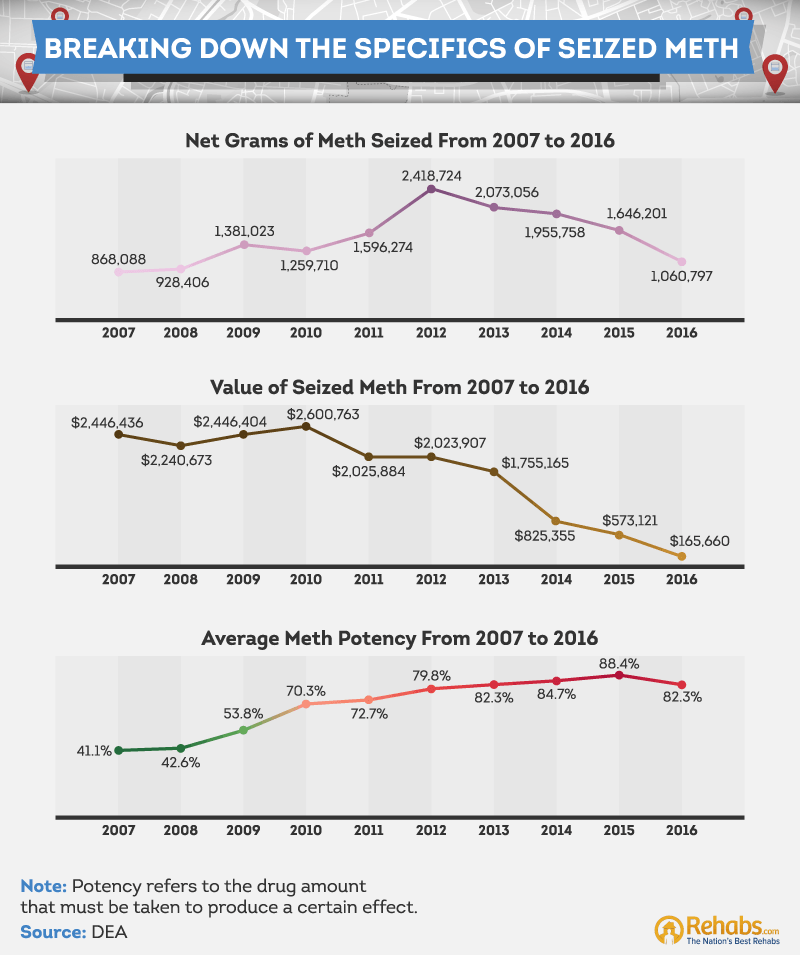
Our data permit us to study the volume and potency of meth seized from 2006 through 2017, tracking trends over that period.
In terms of the total amount of meth confiscated annually, the amount seized increased significantly between 2006 and 2012, before falling in each subsequent year. Although this trend may seem encouraging at first glance, the decline in meth seized may reflect a change in manufacturing patterns. Whereas confiscating products from domestic labs was once a reliable strategy for seizing large quantities of meth, much production now takes place in Mexico instead.
The street value of meth seized by year has also declined precipitously in recent years, and not just because less has been seized overall. Meth has become increasingly affordable as of late, another trend authorities attribute to industrial-scale cartel production. Simultaneously, the potency of meth has skyrocketed. In 2007, confiscated meth was 41 percent pure on average. In 2016, it was exactly twice as potent.
Resurgent Risk
Our findings reveal a grim set of circumstances: Meth is more potent than in its mid-2000s heyday, and far more affordable as well.
In many states, lab busts have been exceedingly common; in others, a startling amount of methamphetamine has been seized. In many ways, meth’s return to national prominence indicates the limits of drug interdiction. Although meth’s availability declined for a time as domestic production slowed, other sources have since moved to fill that void. Halting the flood of drugs is a worthy ambition, but policymakers must address the demand for these substances as well by investing in treatment resources.
For those desperate to end their drug use, navigating the complex array of substance abuse treatment options can be difficult. Access to treatment in America presents a cruel irony: Getting drugs is often easier than getting help.
If you find yourself in this position, don’t get discouraged from seeking the care that could save your life. If you’re ready to find treatment, American Addiction Centers can help. With facilities across the country, AAC offers various levels of evidence-based care to suit your needs. Contact us by 24 hours a day, 7 days a week, or verify your insurance now and reach out for more information later. Our admissions navigators are here to answer your questions, discuss treatment options, and help you begin the admissions process once you’re ready.