Addiction Charities

If you asked the average person on the street how many people in the United States are addicted to drugs or alcohol, he or she might be able to use anecdotal observations or half-remembered news reports to hazard a reasonable guess. The actual answer, according to the 2014 installment of the National Survey on Drug Use and Health, is 8 in every 100.2
However, if you asked the same person how many substance abuse charities exist to help those people, or even how many charities of any description there are in the United States, it’s safe to say they wouldn’t have a clue. That’s because, unless their work is being promoted by celebrities like Elton John or Ted Danson,3 substance abuse charities rarely make the headlines.
We’ve trawled data from IRS tax returns to explore how billions of dollars are spent by more than 4,000 substance abuse charities across the country.
The results show that, in spite of falling dramatically in the wake of the 2008 economic crisis, addiction nonprofit revenues currently account for $21 out of every $100 spent on the prevention and treatment of substance abuse in the United States.
While nonprofits account for 20 percent of the efforts to reduce the effects of substance abuse, the growth of nonprofits in the space has not kept pace with the increasing number of individuals in need of substance abuse treatment.
How Substance Abuse Charities Fit into the Bigger Nonprofit Picture
 According to the IRS, there are at least 1.58 million registered nonprofits in the United States, belonging to more than 30 tax-exempt categories.4 More than two-thirds are public charities. Unlike private foundations, they usually receive funding from multiple sources – including the general public and government grants – and spend the majority of their revenue on the programs and activities for which they were granted tax-exempt status.5
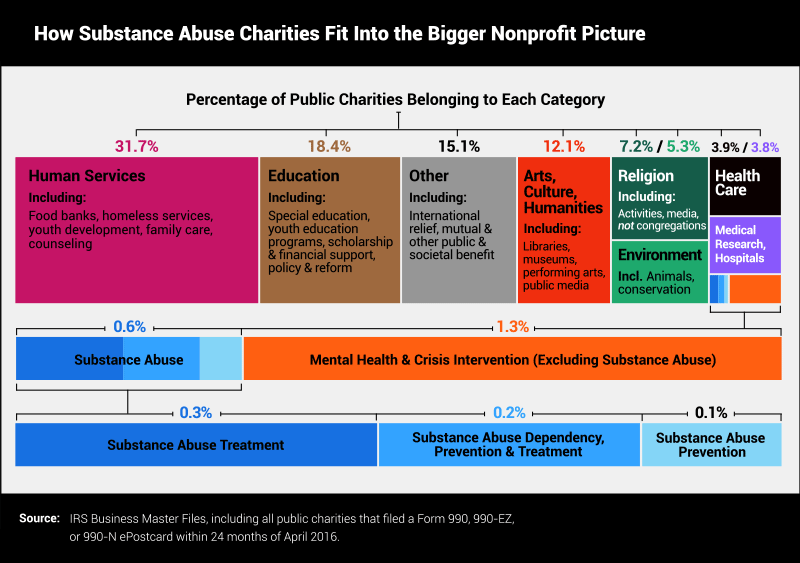
The graphic above shows how the 739,847 public charities that filed tax returns within 24 months of April 2016 were split by category. Almost one-third belong to Human Services, which includes recreation and sports; housing and shelter; and food, agriculture, and nutrition. About 1 in 5 belongs to Education; roughly 1 in 10 to Arts, Culture, and Humanities; 1 in 20 to Environment, and just under 2 in 100 to Mental Health and Crisis Intervention. This final category includes all substance abuse charities.
Totaling only 4,108 as of April 2016, substance abuse charities represent a tiny piece of the nonprofit pie.6 However, they do comprise roughly one-third of all Mental Health and Crisis Intervention charities, and almost seven times more than sexual assault, gambling addiction, eating disorders, smoking addiction, and other addictive disorder charities combined. The number of substance abuse nonprofits relative to charities focused on other forms of addiction hints at the scale of the United State’s problem with drug use.
There are three categories of substance abuse charities: 47% focus on treatment only; 34.5% tackle dependency, prevention and treatment; and 18.5% are dedicated solely to prevention.
It makes sense that substance abuse charities are easily outnumbered by organizations that focus on causes that affect more people, like education and food banks, but how has their number changed in recent years relative to the other, broader nonprofit categories?
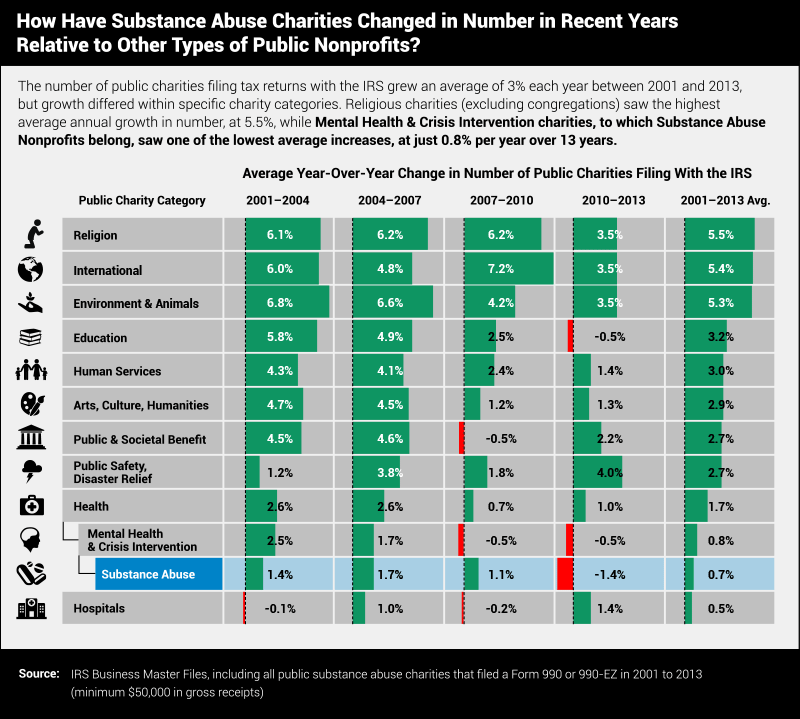 The total number of public charities has been on the rise for more than a decade. Between 2003 and 2013, the total grew 19.5%. This growth was significantly faster than other types of nonprofits, like private foundations, which only grew 2.8%. Not all types of charities have grown in number at equal rates though.
Religious public charities (excluding congregations) had the highest average yearly growth between 2000 and 2013, at 5.5%, followed by International Organizations (5.4%) and Environment and Animals (5.3%).
Health, which includes Mental Health and Crisis Intervention (and therefore substance abuse nonprofits), only grew an average of 1.7% per year. Substance abuse charities alone grew just 0.7% – this was in large part due to a significant decrease in the number of organizations filing tax returns between 2010 and 2013.
In contrast, the number of people using drugs (mostly marijuana and prescription pills without a prescription) has risen more dramatically in recent years, with about 1 in 10 Americans reporting past month use in 2014, which was more than in any other year from 2002 through 2013.1
 The total number of substance abuse charities is only one part of the nonprofit picture. What really counts is how much money they raise and spend on prevention and treatment.
 A public charity’s revenue includes every dollar it spends during its fiscal year, including the things that directly help people in need, like programs and services. It also includes things that keep the organization running, like salaries, fundraising, and other overhead costs.
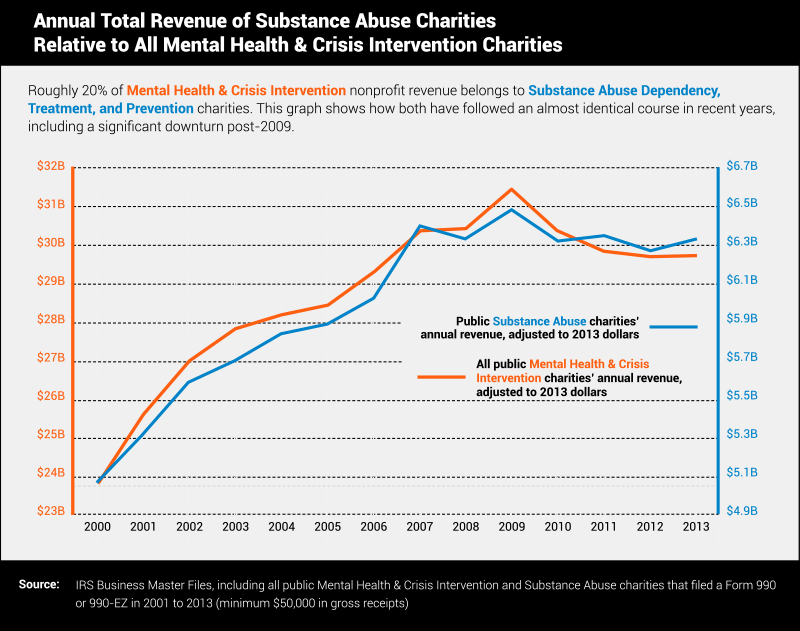
The chart above compares the total annual revenues of all Mental Health and Crisis Intervention charities with the total annual revenues of Substance Abuse charities between 2000 and 2013. We’ve chosen 2013 as our most recent year because many charities are up to two years in arrears filing their tax returns, due to when their fiscal years begin, IRS filing extensions, and other factors (see the notes at the end for a full explanation).7
![]()
Mental Health and Crisis Intervention charities’ total revenue was $29.8 billion in 2013, which was 1.7% of the $1.74 trillion in total public charity revenue. 21.2% of Mental Health and Crisis Intervention revenue was by Substance Abuse charities, equivalent to $6.3 billion. Preliminary data show the equivalent figure for 2016 is $6.7 billion, which, after adjusting for inflation, is 3% ($200 million) more than in 2013.
We can get a clearer picture of how revenues have changed by adjusting each year’s figures for inflation.
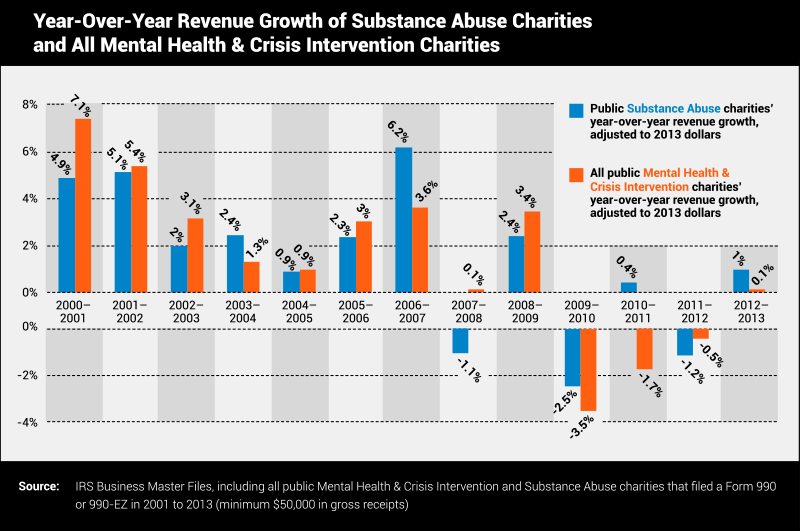 Public charity revenue experienced substantial increases between 2000 and 2008, but then the recession hit and slowed the growth rate of hundreds of thousands of charities to levels far below those seen in the early-2000s.5 Some types of charities actually saw a decline in revenue post-2008, particularly in the International and Foreign Affairs and Arts, Culture, and Humanities sectors. Mental Health and Crisis Intervention and Substance Abuse charities didn’t escape the effects of the economic crisis either and also saw declines in revenue.
 In 2013, the total revenues of Mental Health and Crisis Intervention and Substance Abuse charities had started to recover from the effects of the recession and were both higher than the previous year for the first time since 2009, albeit only fractionally in the case of Mental Health and Crisis Intervention (0.1%).
Substance Abuse charity revenues grew 1%, which equated to an increase of about $63 million. To put that figure into context: If the entire amount were spent just on treatments for heroin addicts, it would cover a year’s worth of methadone maintenance for 13,400 people.8 In other words, fractional increases in substance abuse nonprofit revenues can equate to life-changing amounts of money for people who need treatment.
Now we have an idea of how many substance abuse charities there are in the whole of the United States and how much revenue they generate, let’s see which parts of the country have the most charities per person and how the finances differ at the state-level.
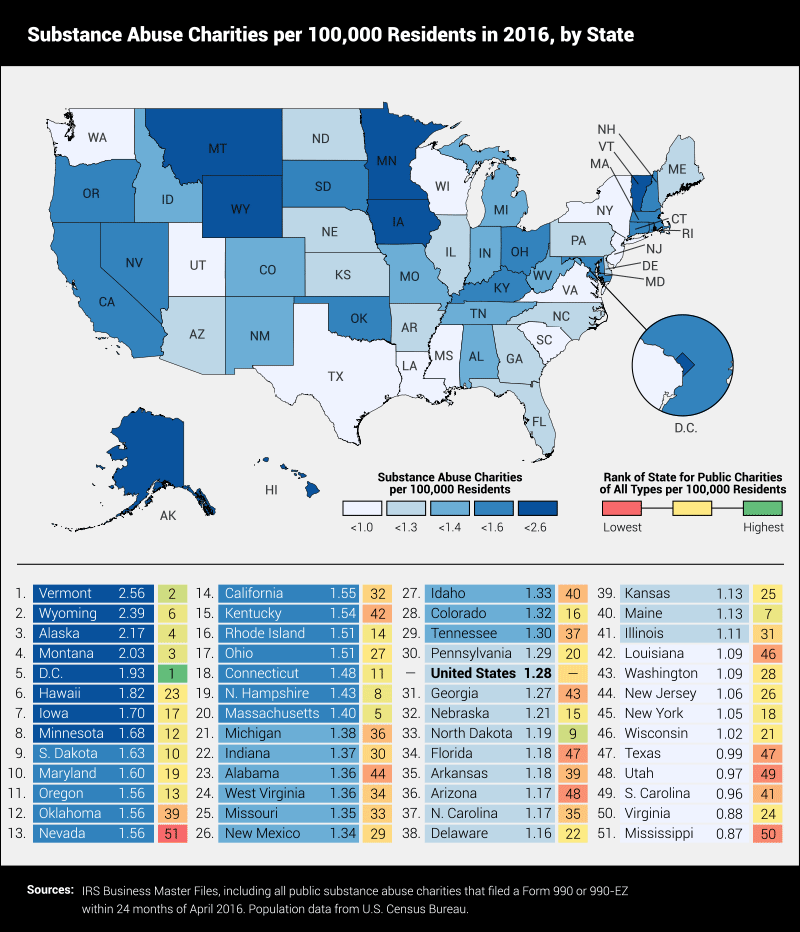 Vermont has more substance abuse charities than any other state, at 2.56 per 100,000 residents. However, it also has the most nonprofits of all categories, largely due to its relatively small population.9 That doesn’t mean the state’s addiction charities aren’t needed, though. In 2013, Vermont had the highest rate of illicit drug use in the country, with 15% of people saying they used an illegal substance within the last month. That was more than three times higher than Utah, the lowest in the country, at 4.2%.10 Interestingly, Utah placed 48th in the country for substance abuse charities per 100,000 residents in our ranking, which suggests there could be a direct link between a state’s total number of addiction charities and its population’s rate of drug use.
Most of the people who admit to using illicit substances are marijuana users,1 but Vermont has faced major problems in recent years with harder drugs. Gov. Peter Shumlin said in 2014 that the region was in a “full-blown heroin crisis,”11 which further justifies the need for substance abuse charity funds within the state.
Certain states in the ranking above stand out because they have high rates of substance abuse charities but low rates of public charities in general. For instance, Nevada ranked lowest in the country for public charities per 100,000 residents, but 13th for substance abuse nonprofits.
Unfortunately, this doesn’t mean Nevadan drug users are necessarily better off than those in other parts of the country. The health care consulting firm Advocates for Human Potential calculated the number of psychiatrists, psychologists, counselors, and social workers available to treat every 1,000 people with a substance use disorder in each state. They found that Nevada ranked the very lowest in the nation, at 11 (the average was 32).12 Highest was Vermont, which as we’ve just seen was also top for substance abuse charities per capita in our analysis.
 The fact that a state like Nevada can rank 13th in the country for the most substance abuse charities per capita, but lowest for the number of available treatment professionals, suggests that its nonprofits are potentially under-equipped, or simply undersized, for the number of drug users in need of help.
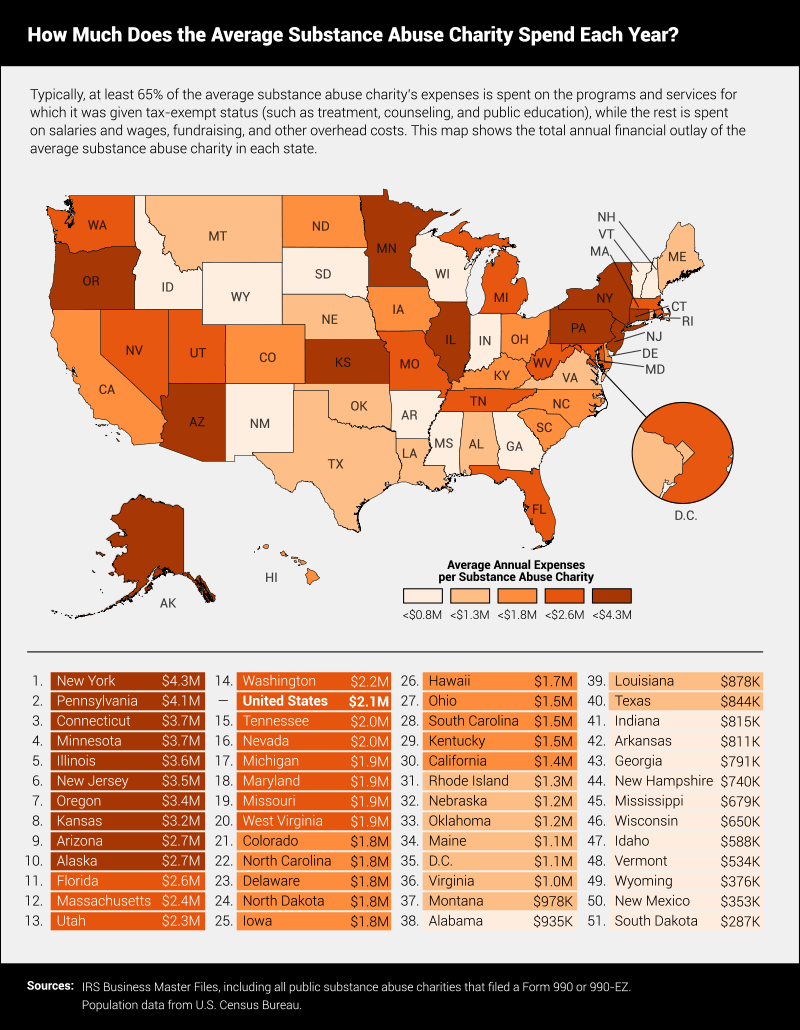
Most substance abuse charities spend the majority of their revenue on the programs and services for which they were awarded tax-exempt status, like treatment, counseling, and public education. The map above shows the annual expenses of the average substance abuse charity in each state.
Substance abuse charities in New York have higher average annual expenses than those in any other state, at $4.3 million per organization. We checked to see if this is because charities of all kinds tend to be larger in New York than in other states; it appears it could be because New York ranked fourth in the country for average annual expenses per public charity. However, there is a difference between the average amount spent by a substance abuse charity in New York versus the average public charity. The average annual expenses of a substance abuse nonprofit in the Empire State are 70% of the average public charity.
This is the case in almost all states: Substance abuse charities tend to have lower revenue than the average charity. South Dakota showed the biggest gap, with the average substance abuse nonprofit’s expenses equaling just 8.4% of the average charity’s expenses.
 To better understand which states benefit most from their substance abuse charities, we can compare nonprofit spending with the actual number of residents who have substance abuse problems.
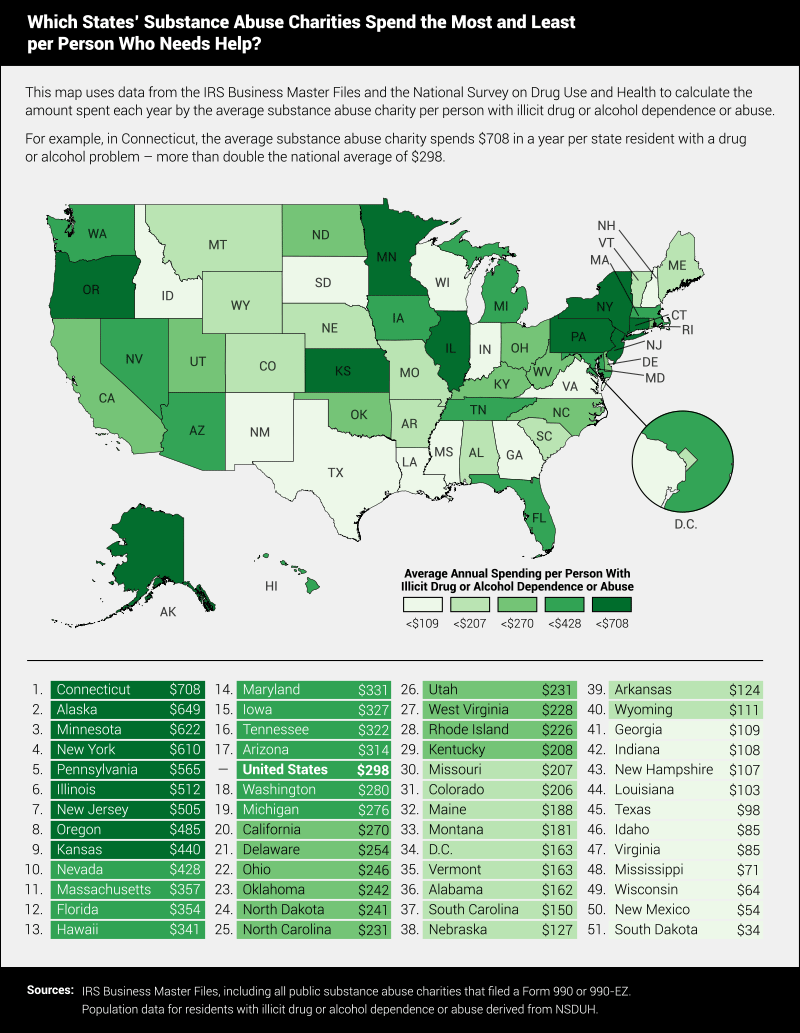 The map above uses data from the 2013 and 2014 National Survey on Drug Use and Health to establish the number of residents in each state with illicit drug or alcohol dependence. It also shows how much the average substance abuse charity spends per person per year (with at least 65 cents of every dollar typically spent on programs and expenses). Combining the state-level drug use figures with the nonprofit financial figures in this way gives us a picture of which states spend the most and least per person in need.
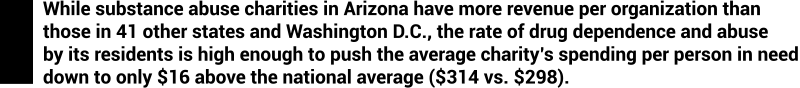
The ranking for average spending per person in need is very similar to the one for average annual expenses per substance abuse charity. In fact, because they have similar rates of drug abuse, nine states appear in the top 10 for both. The only one that doesn’t is Arizona, which ranked ninth for average spending per organization, but – because it has a significantly higher rate of drug abuse – 17th for spending per person in need.
 Another interesting result here is that Connecticut, whose substance abuse charities spent more on average per person in need than any other state in 2013 ($708 versus the national average of $298) has topped similar lists before. A 2009 report by the National Center on Addiction and Substance Abuse at Columbia University found that, in 2005, Connecticut spent more than any other state on substance abuse and addiction prevention and research, at $304 million (1.74% of its state budget). This was almost three times more than Kentucky, which ranked second ($102 million and 0.78% of the budget).13
To more clearly reveal the supply/demand relationship between how much the average substance abuse charity spends per person in need and how many people in need of help there are, we have contrasted the two metrics against each other on the scatter plot below.
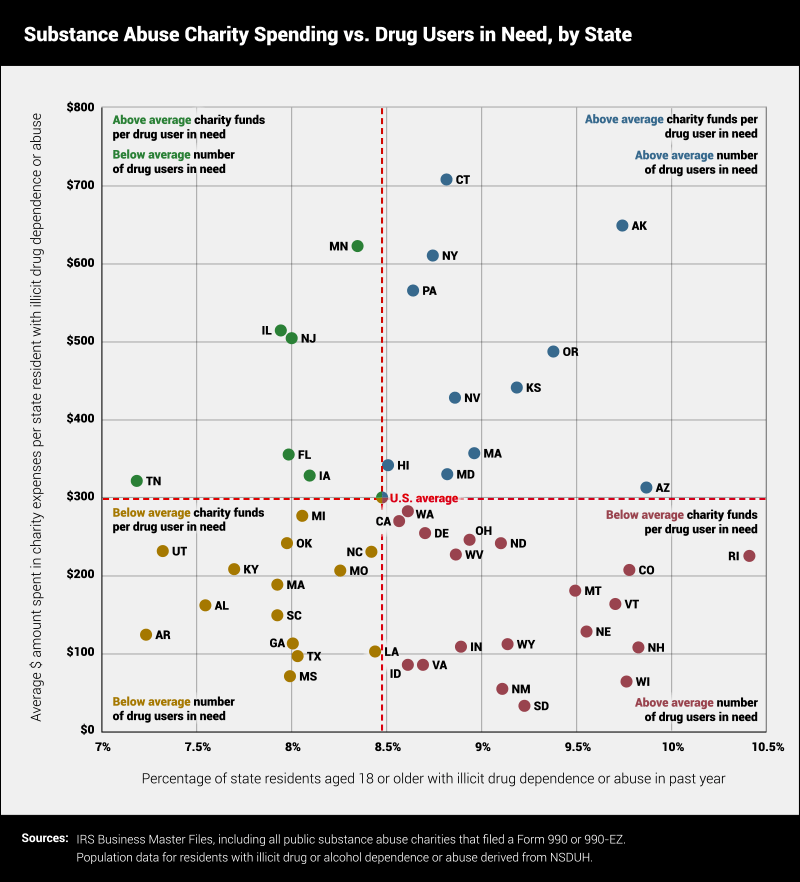 The four quadrants in the scatter plot above represent the demand for charitable funds by persons with drug problems and the average amount spent/supplied per person in need. For example, Minnesota, Illinois, New Jersey, Florida, Tennessee, and Iowa – in the top left quadrant – all have lower than average rates of drug dependence and abuse and higher than average charity spending per person in need.
However, the states in the lower right quadrant are in the opposite situation, with above average percentages of persons in need and below average charitable spending on them.
 While crunching the IRS tax return data, we ran a word frequency count on the names of over 10,000 substance abuse charities (both active and inactive). The most common words were those you’d expect, like “center” and “recovery,” but among them were other more interesting words, representing the positive goals of the charities and the people they help, like “new,” “life,” and “serenity.” We also noticed that the words “prevention” and “treatment” appeared in exactly the same number of organizations’ names: 196 each. This was just an interesting coincidence, but it got us thinking: We’ve already seen that there are roughly 2.5 times more substance abuse charities that focus exclusively on treatment than just on prevention, but how does the ratio differ state-to-state?
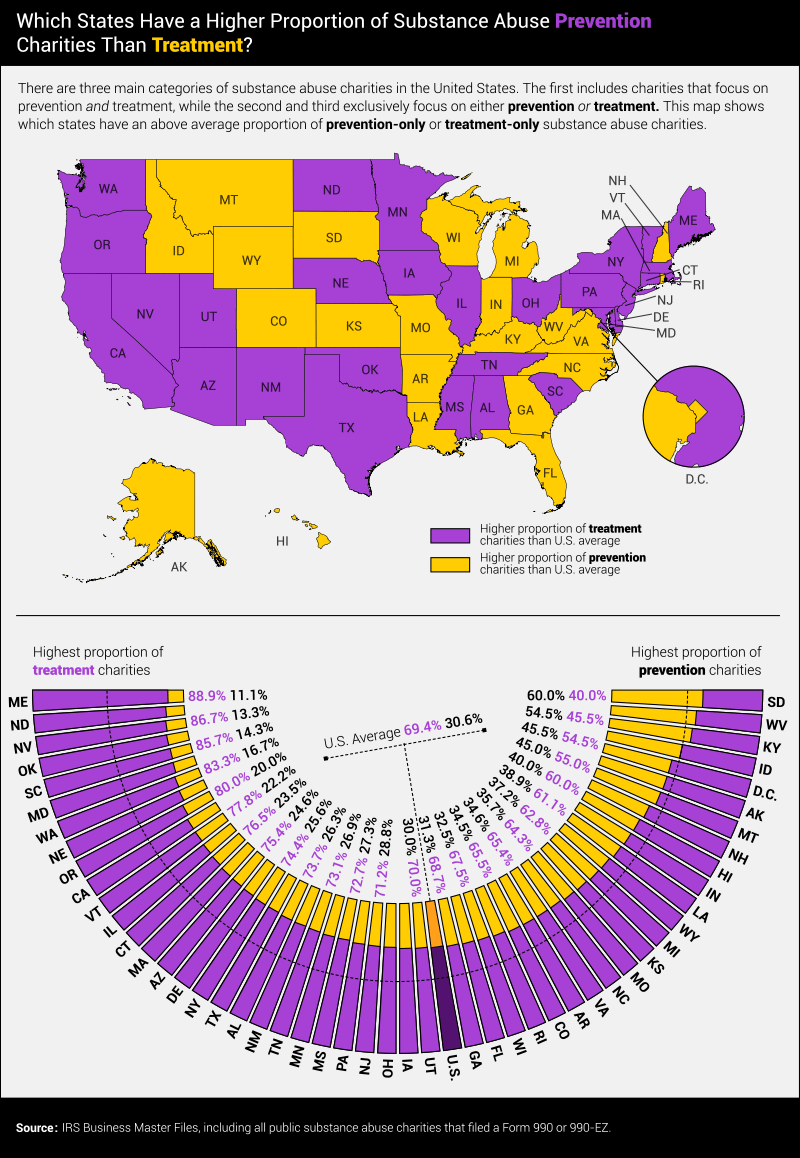 Substance abuse nonprofits comprise 0.6% of the public charities in the United States and, as we saw earlier, are divided into three types. There are those that focus on all aspects of addiction, including prevention and treatment, and ones that exclusively tackle prevention or treatment. The type smallest in number are prevention-only organizations, as they comprise just 0.1% of all public charities, or about 1 in 5 substance abuse nonprofits.
![]() Substance abuse treatment charities outnumber prevention charities in 47 states. Maine had the highest treatment-to-prevention ratio in 2013, at 88.9% to 11.1%. This relationship of treatment charities far outnumbering prevention charities is mirrored in government spending. The 2009 report by the National Center on Addiction and Substance Abuse mentioned earlier found that, in 2005, the federal government spent $1.6 billion to prevent substance abuse and addiction, but $2.4 billion (1.5 times more) on the treatment of substance use disorders. States in the same year exhibited the same bias toward treatment, spending a total of $2.4 billion on it versus $418 million on prevention.
Substance abuse treatment charities outnumber prevention charities in 47 states. Maine had the highest treatment-to-prevention ratio in 2013, at 88.9% to 11.1%. This relationship of treatment charities far outnumbering prevention charities is mirrored in government spending. The 2009 report by the National Center on Addiction and Substance Abuse mentioned earlier found that, in 2005, the federal government spent $1.6 billion to prevent substance abuse and addiction, but $2.4 billion (1.5 times more) on the treatment of substance use disorders. States in the same year exhibited the same bias toward treatment, spending a total of $2.4 billion on it versus $418 million on prevention.
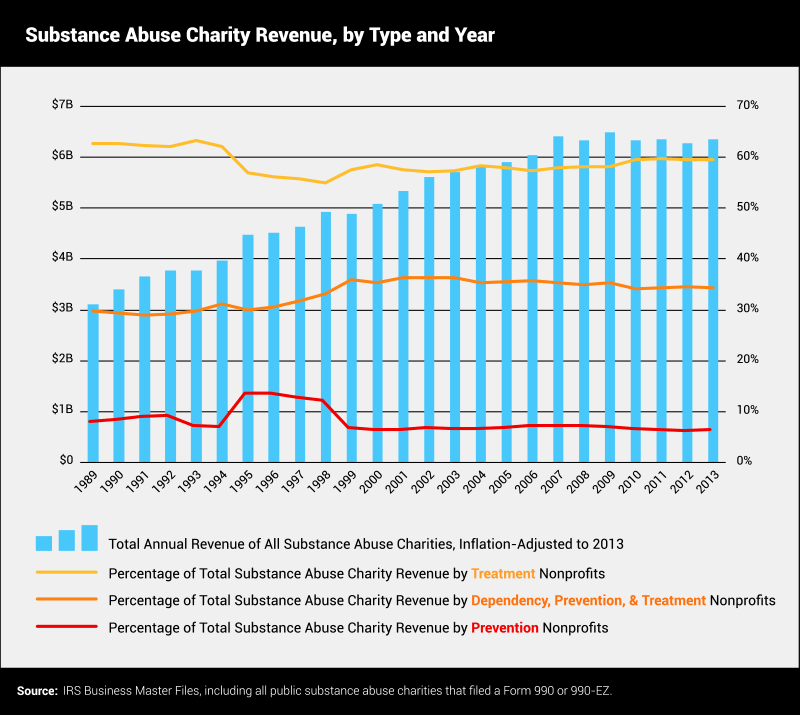
 The graph below sums up how the annual revenue of substance abuse charities changed between 1989 and 2013, as well as how it was split between organizations which focused on dependency, prevention, and treatment and those which focused on just prevention or treatment.
Overall, substance abuse charities have consistently increased their total annual revenue over the last 25 years. The distribution of revenue across the three charity types has remained remarkably similar as well. The only change has been a slight and gradual shift toward a higher proportion of revenue coming from charities that focus on all the issues surrounding substance abuse and addiction, as opposed to only prevention or treatment.
 While various states are in the process of amending their marijuana laws, other drugs continue to have a devastating effect on millions of people across the country. The 2017 National Drug Control Budget describes the current nonmedical opioid medication epidemic as “taking a heartbreaking toll on many Americans and their families, while straining [the] resources of law enforcement and treatment programs.”14
According to the same report, in 2016, $14.7 billion will be spent by the U.S. government on substance abuse prevention and treatment. Preliminary 2016 IRS data we have analyzed shows that approximately $6.7 billion in substance abuse charity revenue will be focused on the same cause. In other words, across these two major sources of funds, substance abuse charities are responsible for $21 out of every $100 spent on preventing and treating drug addiction in the United States. The positive impact of these nonprofit organizations in the fight against addiction, therefore, cannot be underestimated.